

The dihedral (torsion) angles
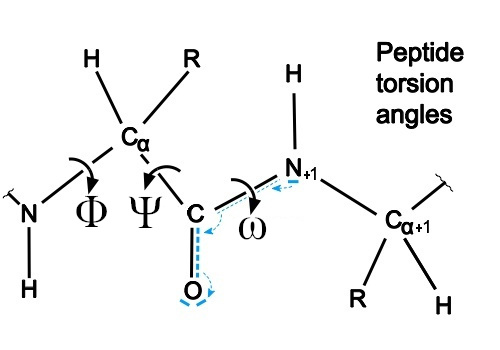
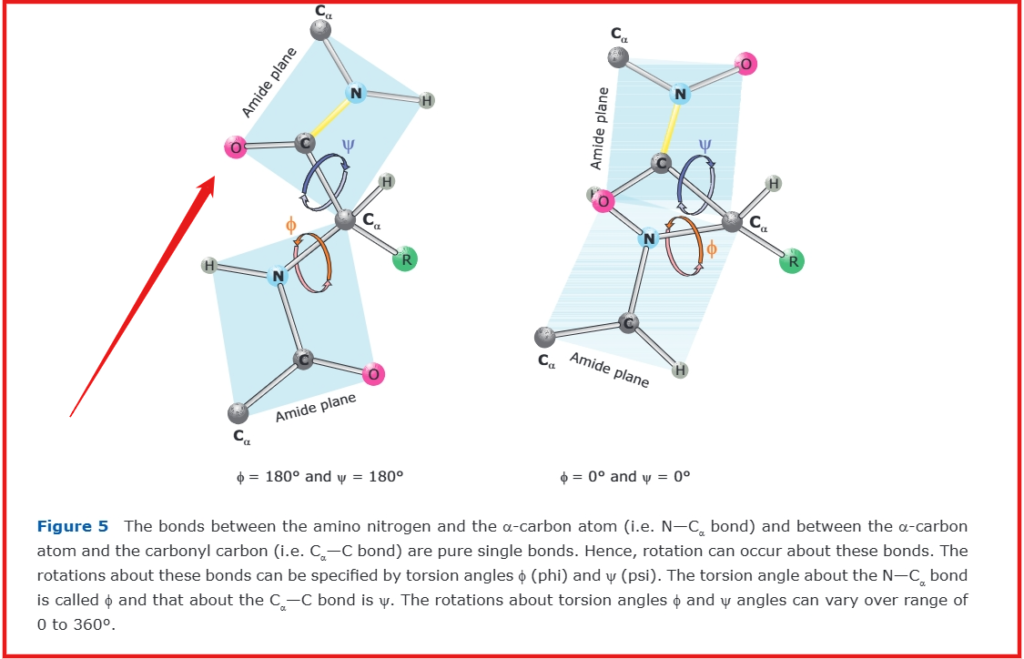
The dihedral (torsion) angles in a protein chain are the rotational angles around the bonds in the polypeptide backbone. The φ (phi) angle describes rotation around the N-Cα bond and is measured between C-N-Cα-C, while the ψ (psi) angle describes rotation around the Cα-C bond and is measured between N-Cα-C-N. A third angle, ω (omega), describes rotation around the peptide bond (C-N). These angles are specifically defined as:
- φ (phi): rotation about the C-N-Cα-C bond
- ψ (psi): rotation about the N-Cα-C-N bond
- ω (omega): rotation about the Cα-C-N-Cα bond
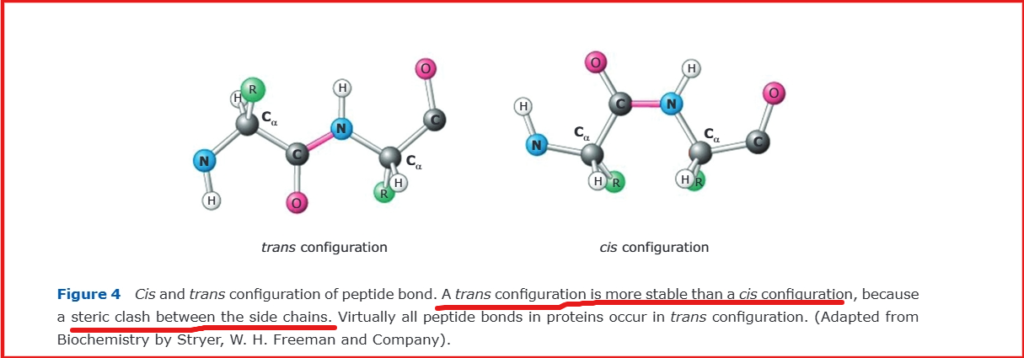
The ω angle is typically planar, while φ and ψ exhibit considerable rotational freedom. The planarity of ω results from the partial double-bond character of the peptide bond due to resonance effects, effectively preventing rotation. The allowed values of φ and ψ are severely restricted by steric interference. The peptide bond preferentially adopts a trans configuration (≈180°) between consecutive side chains due to steric considerations, while the cis configuration (≈0°) is rare, occurring predominantly in proline residues.
Dihedral (torsion) angles illustration
The terminal residues in a polypeptide chain lack complete sets of φ/ψ angles due to their unique positioning. A residue requires peptide bonds with both preceding and subsequent amino acids to define both torsion angles. Specifically, the N-terminal residue lacks an φ angle because it has no preceding peptide bond, while the C-terminal residue lacks an ψ angle due to the absence of a subsequent peptide bond.
The Ramachandran Plot
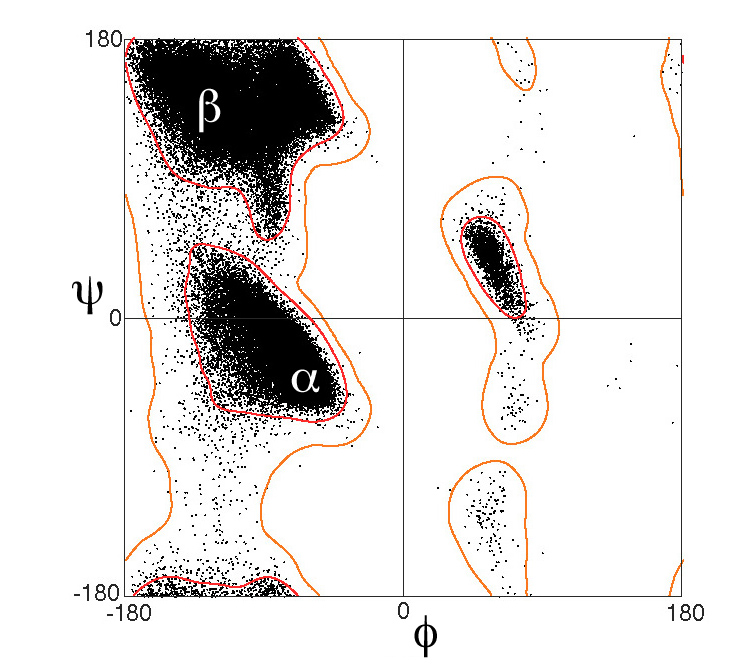
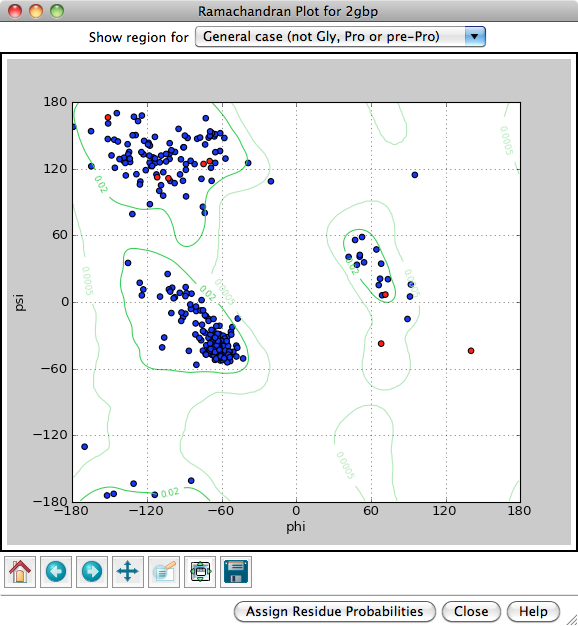
A Ramachandran plot (also known as a Ramachandran diagram or a [φ,ψ] plot), was originally developed in 1963 by G. N. Ramachandran, C. Ramakrishnan, and V. Sasisekharan. A graph between the dihedral angles of an amino acid in a protein. A plot between the dihedral angles of individual amino acids in a protein can serve to indicate how well the structure has been determined.
Ramachandran plot is a two-dimensional (2D) plot of the torsional angles of amino acids φ (phi) and ψ (psi) in a protein sequence.The Ramachandran Principle
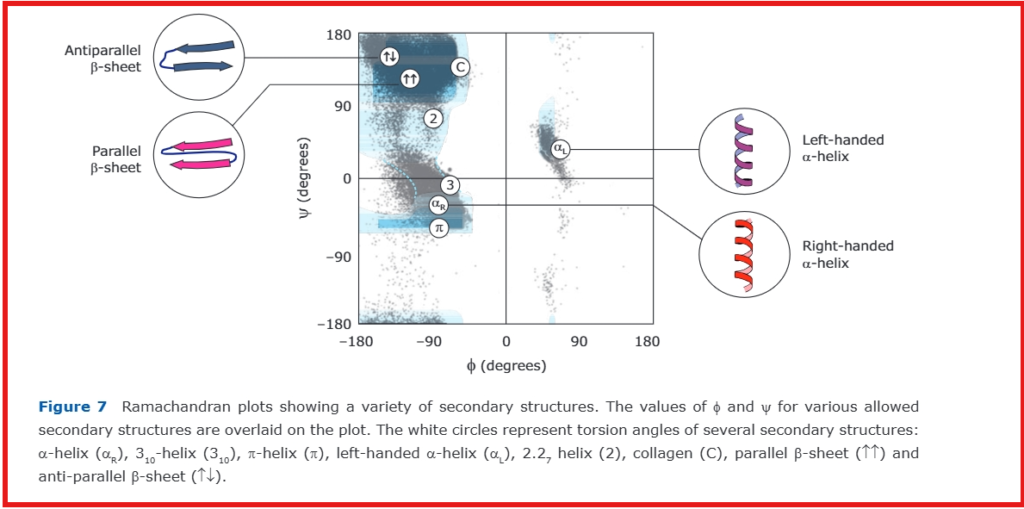
Phi (φ) and Psi (ψ) Angles determine the conformation of a polypeptide in protein. The Ramachandran Principle states that alpha helices, beta strands, and turns are the most likely conformations for a polypeptide chain to adopt because most other conformations are impossible due to steric collisions between atoms.
Predicting secondary structure from Ramachandran plot
A plot of the dihedral angles of individual amino acids in a protein can indicate the accuracy of the structure determination. Deviations from the allowed values, known as outliers, typically suggest poor geometry.
Ramachandran Plot Analysis Tools
| Tool Name | Key Features | Platform | Citation |
|---|---|---|---|
| PROCHECK | Classical validation, statistical analysis, multiple plot types | Unix/Linux | Laskowski et al., 1993, J Appl Crystallogr |
| MolProbity | All-atom contact analysis, updated φ/ψ distributions | Web/Local | Williams et al., 2018, Protein Sci |
| Ramplot | Plot all types of Ramachandran maps, 2D & 3D plots, six distinct categories of maps. | Web and Python package | Ramachandran Map |
| RAMPAGE | Web-based analysis, publication-quality plots, batch processing | Web | Lovell et al., 2003, Proteins |
| SAVES | Meta-server combining multiple validation tools | Web | NIH-supported resource* |
| VERIFY3D | Environmental profile analysis with Ramachandran correlation | Web/Local | Lüthy et al., 1992, Nature |
| Richardson Lab’s Viewer | Updated residue-specific plots, teaching tools | Web | Kyle E. Roberts and Bruce R. Donald (2014). |
Applications of Ramachandran Plot Analysis
- Structure validation and quality assessment of protein models from experimental methods (X-ray crystallography, NMR spectroscopy, cryo-EM)
- Real-time validation during protein structure refinement and model building processes
- Identification and analysis of sterically forbidden conformations that indicate potential errors in structural models
- Classification and validation of protein secondary structure elements through φ/ψ angle distributions
- Quality assessment of computationally predicted protein structures, including those generated by modern AI/ML methods
- Analysis of active site geometry and conformational changes during protein-ligand interactions
- Educational tool for demonstrating fundamental principles of protein structure and backbone geometry
- Investigation of unusual/rare backbone conformations that may have functional significance
- Assessment of conformational changes in protein engineering and design applications
- Validation of structure-based drug design models and protein-ligand complexes
Based on: Foundational concepts from Ramachandran et al., 1963 and contemporary structural biology practices.
References
- RAMACHANDRAN, G N et al. “Stereochemistry of polypeptide chain configurations.” Journal of molecular biology vol. 7 (1963): 95-9. doi:10.1016/s0022-2836(63)80023-6
- Structure validation by Cα geometry: φ,ψ and Cβ deviation. Lovell SC, Davis IW, Arendall WB 3rd, de Bakker PI, Word JM, Prisant MG, Richardson JS, Richardson DC. Proteins. 2003 Feb 15;50(3):437-50.
- Kumar, Pranav & Arya, Aditya. (2019). Ramachandran plot- A simplified approach.
- Andres Liljas, Lars Liljas, Jure Piskur, Göran Lindblom, Poul Nissen, Morten Kjeldgaard: TEXTBOOK OF STRUCTURAL BIOLOGY , World Scientific, 2009.
- Ramachandran Animation. (n.d.). https://bioinformatics.org/molvis/phipsi/
- Secondary structure and backbone conformation | SWISS-MODEL. (n.d.).
